I frequently encounter the \(\Phi\) and \(\Phi^{-1}\) functions in statistical texts. For some reason, the notation always throws me off guard, and I have to spend a few minutes visualizing. This post draws a definitive link between the functions and corresponding graphs. This ought to help me save some time and build more solid understanding of the concepts that make use of this.
The \(\Phi\) function is simply cumulative distribution function, \(F\), of a standard normal distribution.
\[\Phi(z) = \int_{-\infty}^z\dfrac{1}{\sqrt{2\pi}\sigma}e^{-\frac{(x-\sigma)^2}{2\sigma^2}}dx\]
It denotes the probability of a standard normal random variable taking a value smaller than or equal to the value \(z\). In other words, the function returns the quantile of z. Some sources may have slightly different definition to it, but the spirit remains the same.
Depending on how you want to visualize it, the output of \(\Phi\) can be visualized using p.d.f. and c.d.f.
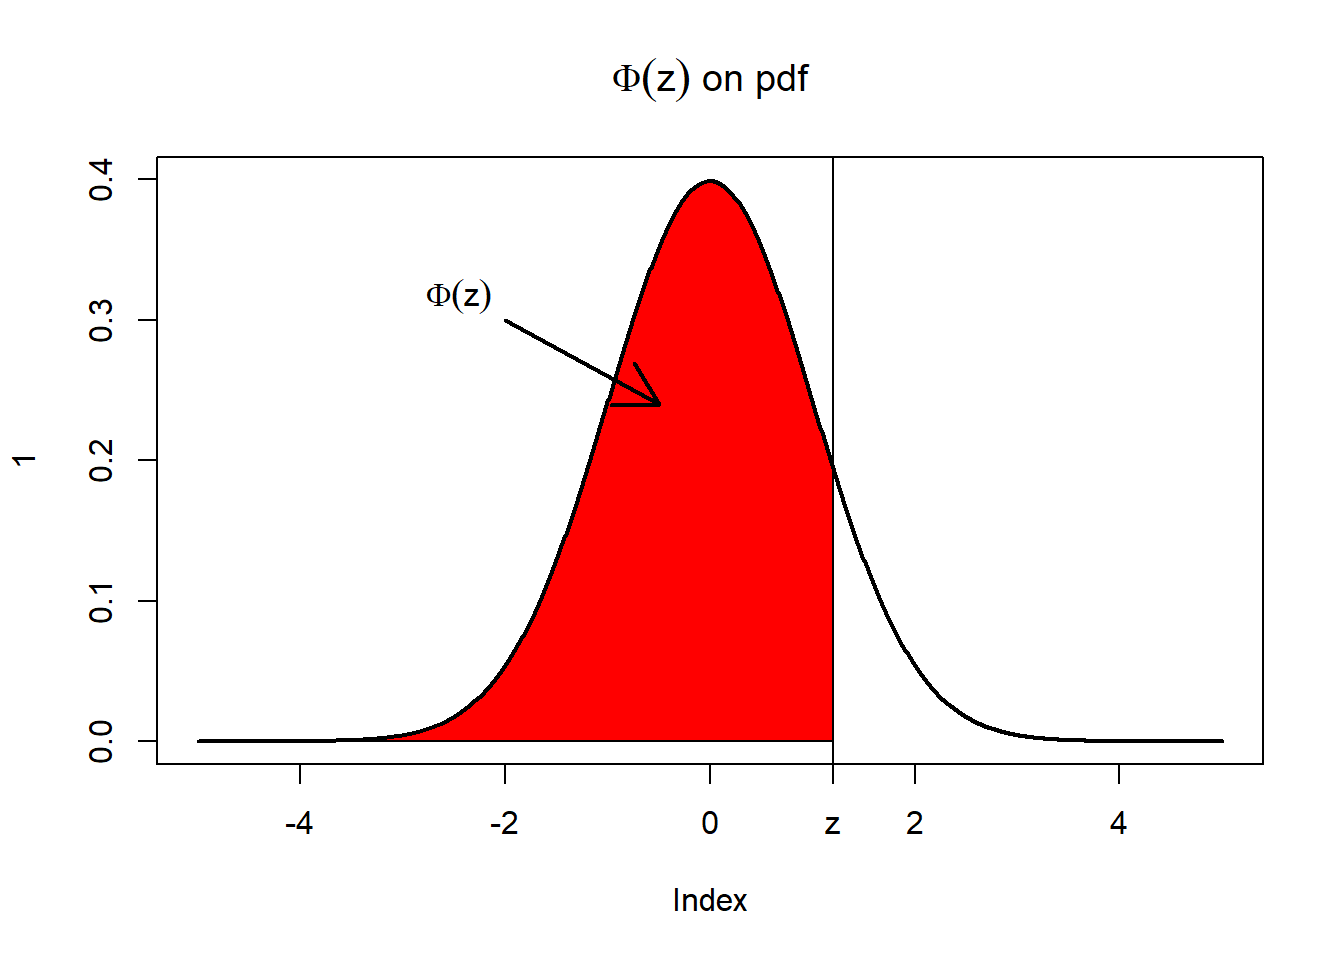
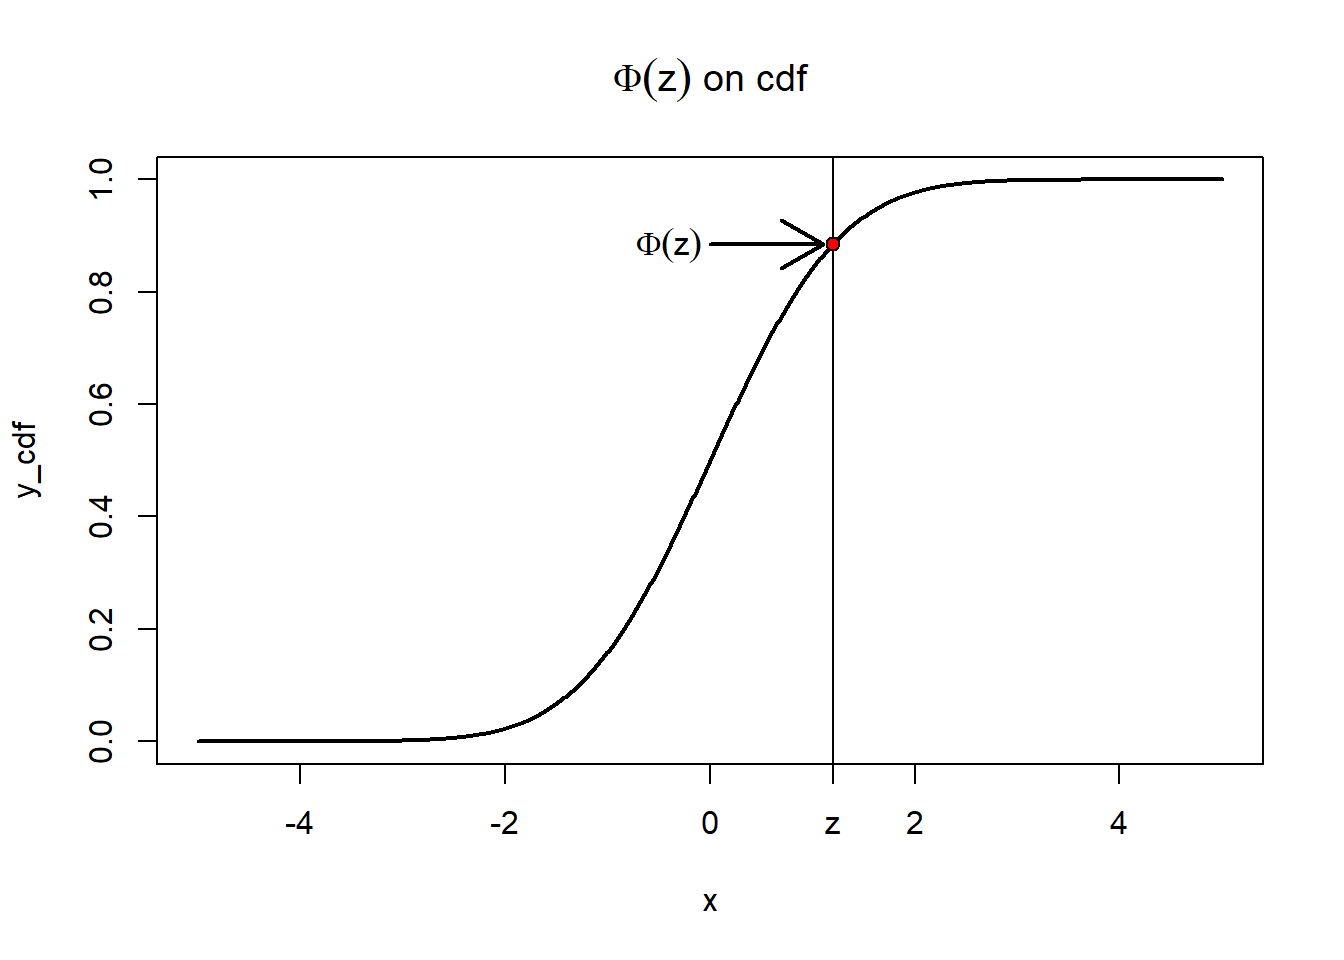
The arrows point to the output of the function. On p.d.f., it is the area under the curve until the point \(z\). On c.d.f., it is the point on the curve when \(x = z\).
The \(\Phi\) function may be brought up in the hypothesis testing context. What should be remembered is that the domain of the function is that of a standardized normal variable. The output won’t make sense if the input is from an arbitrary normal distribution. If you have a value that comes from a non-stanardized normal distribution (I don’t know if that’s an actual term), you’ll have to standardize it first to find the quantile.
If I have value of -20.5 from some population \(p\) that assumes normal distribution where \(\mu = -10\) and \(\sigma^2 = 5^2\), \[F_p(-20.5) = \Phi\big(\frac{-20.5 - (-10)}{5}\big) = \Phi(-2.1)\]
\(\Phi^{-1}\) is no more complicated than its inverse. The notation itself doesn’t necessarily come to me as second nature, as would mathematical notations like \(+\), \(\otimes\), and \(\int\). So I like to translate the function into words. \(\Phi^{-1}(q)\) is essentially a standard normal variable in qth quantile.
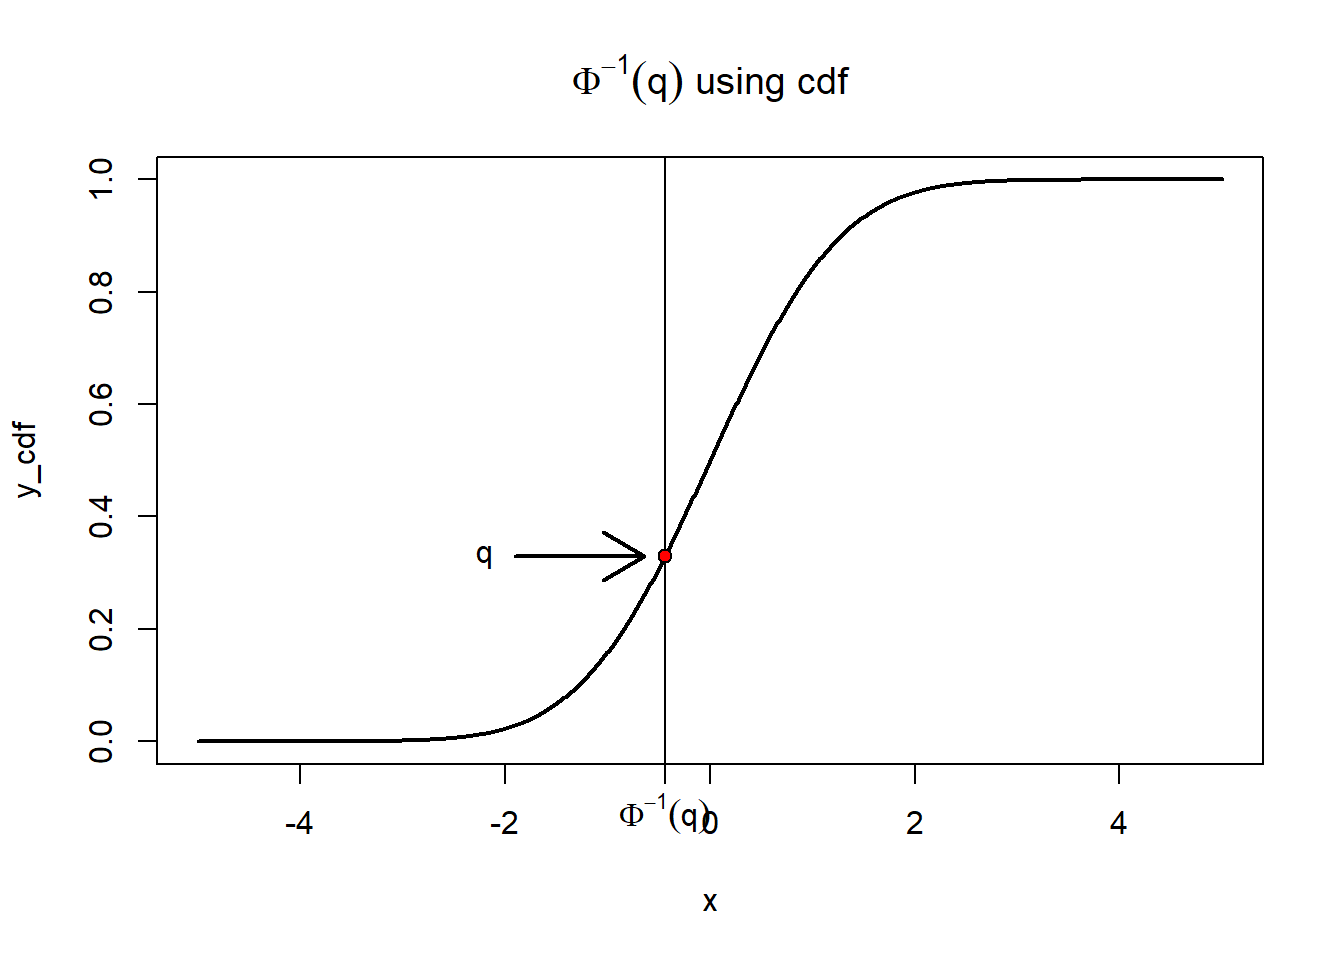
That’s all there is to it folks. \(\Phi(z)\) accepts a value that is a standard normal random variable and spits out the corresponding quantile, while \(\Phi^{-1}\) accepts a quantile, \(q \in [0,1]\), and returns the corresponding z-value.
This topic is by no means complicated, but by forcing myself to write about this trivial topic and create visuals definitely helps me become more familiar with these kinds of notations. Building this familiarity with statistical terms comes in handy especially when I’m trying to read through journals or textbooks fluently without the need to stop and think about what the letters mean. Now I can spare myself a few minutes from having to remember what \(\Phi^{-1}\) means :).